
You are watching the kWh meter climb while your throughput stays flat — or drops. You swap the impeller, adjust the VFD, and hope the next month looks better. It does not. The pump still runs, the motor still draws, but the cost per ton moved keeps rising.
That is not a pump failure. It is a system efficiency problem that a pump swap cannot fix.
This article gives you a field-tested method to diagnose why your slurry pumping efficiency is falling, separate system losses from pump degradation, and apply corrections that lower your kWh/ton without trading away wear life or throughput. You will leave with a measurement baseline, a symptom-to-cause matrix, and a 7-step audit checklist you can use on your next shift.
Key Terms
– kWh/ton: Energy consumed per ton of dry solids moved. The most useful single-number metric for slurry pumping efficiency.
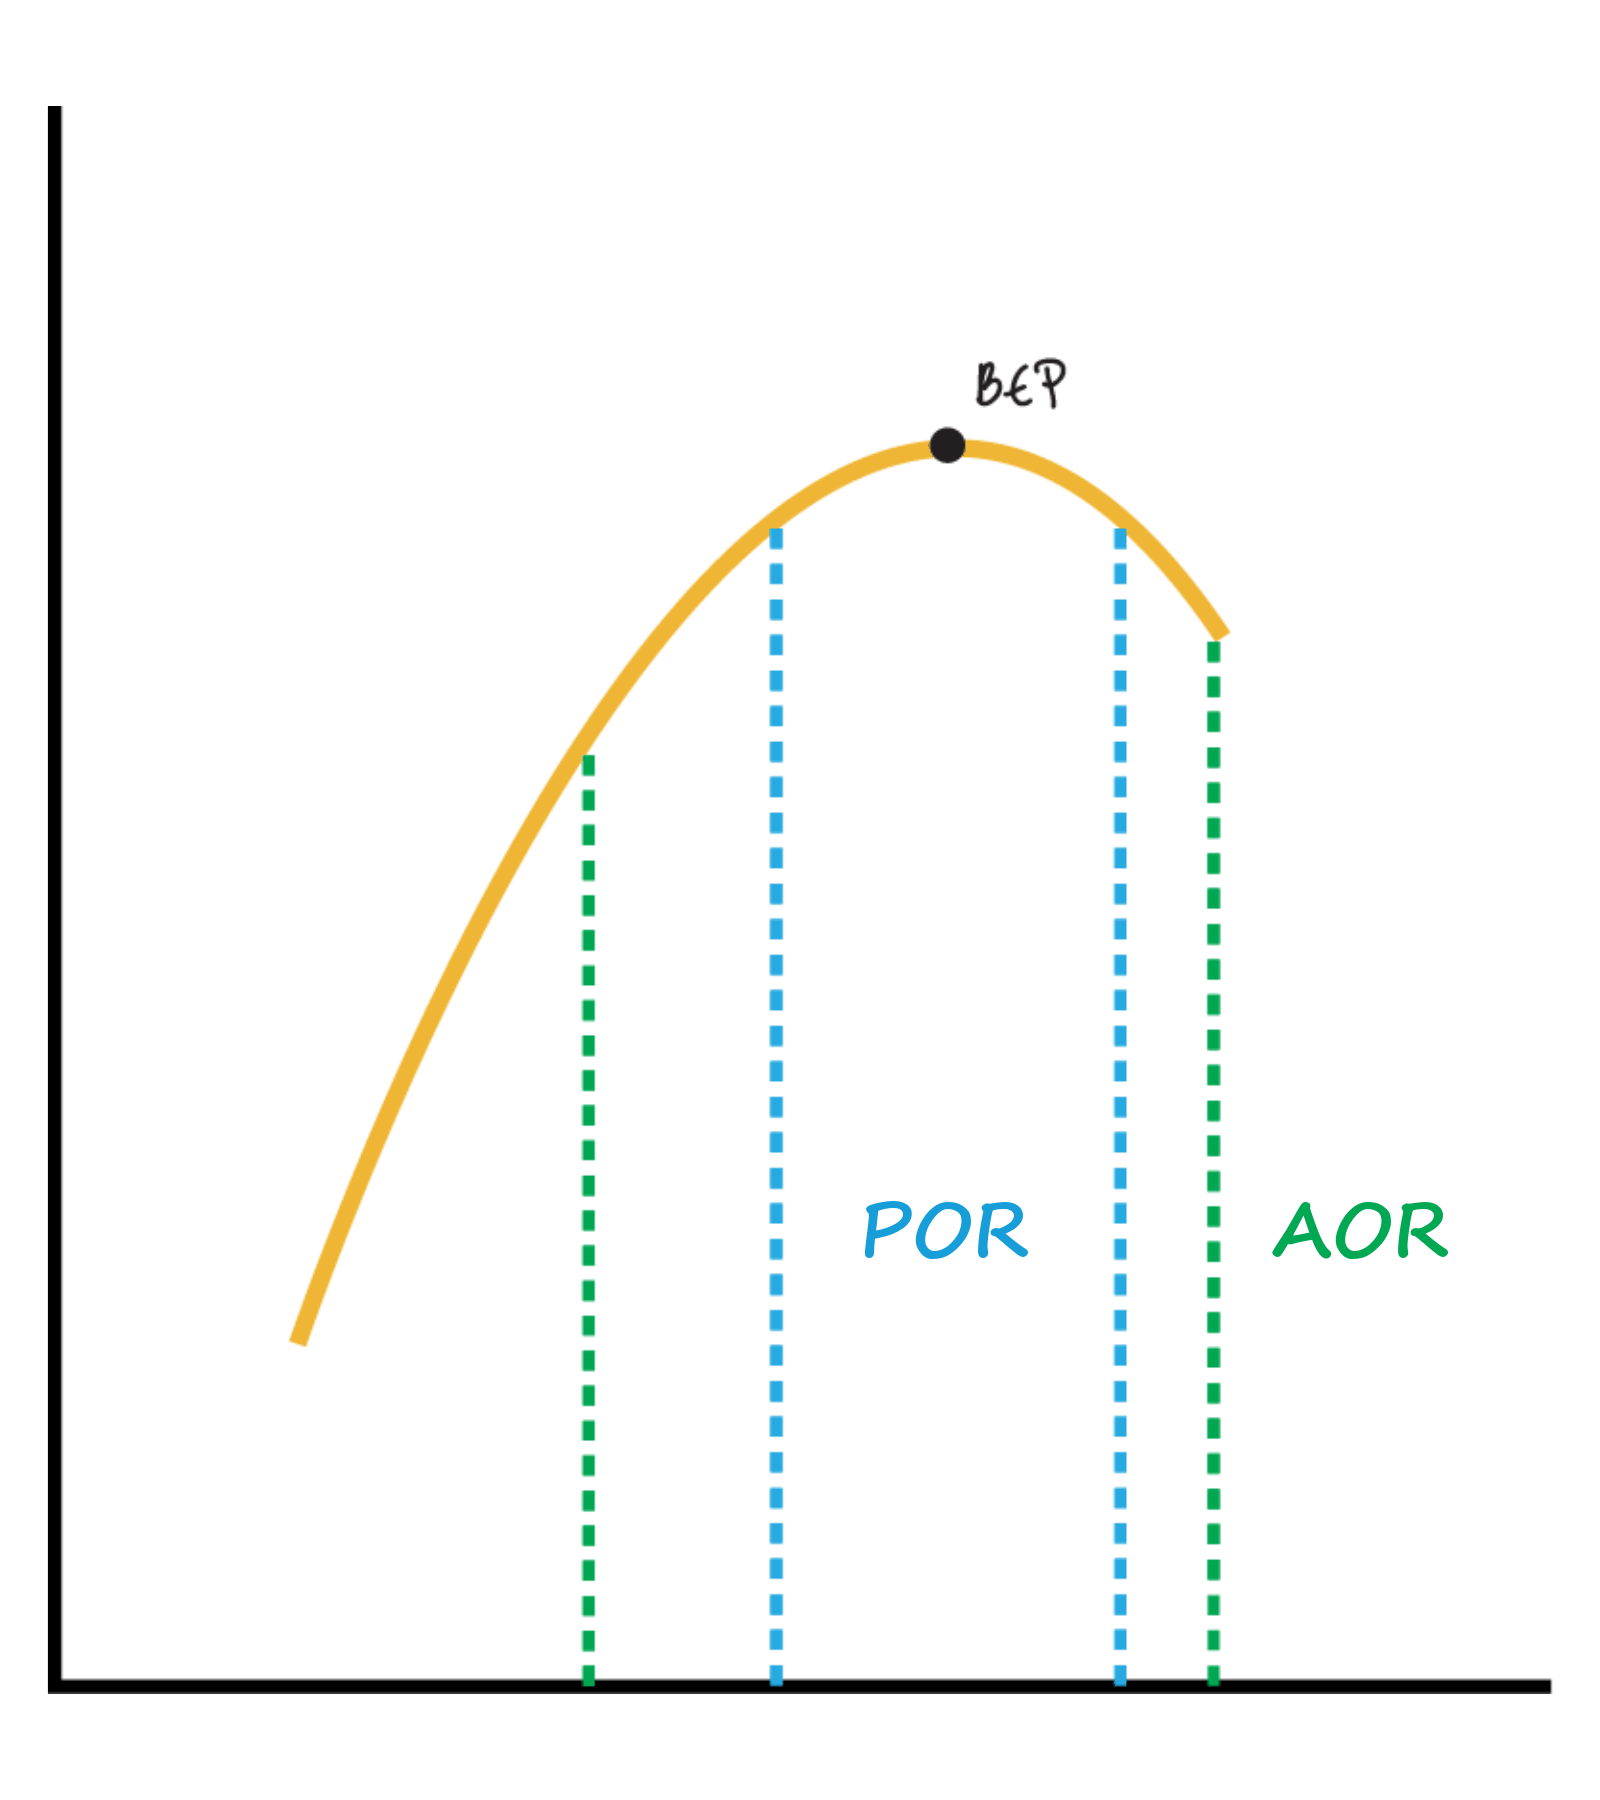
– BEP (Best Efficiency Point): The flow rate at which the pump's hydraulic design operates at peak efficiency on water.
– POR / AOR (Preferred / Allowable Operating Region): The flow ranges around BEP where a pump can run reliably. POR is the narrower, higher-reliability band; AOR is the wider acceptable range.
– System curve: A plot of total head required by the piping and process versus flow. The pump operates where its curve intersects the system curve.
– Specific gravity (SG): The ratio of slurry density to water density. Solid particles raise SG and directly increase pump power draw.
– PSD (Particle Size Distribution): The range and proportion of solid particle sizes in the slurry. PSD affects settling behavior, wear rate, and rheology.
– Critical deposition velocity: The minimum flow velocity needed to prevent solids from settling and forming a stationary bed in the pipeline. Below this velocity, plugging risk increases sharply.
– Internal recirculation: Flow that leaks back from the high-pressure side of the impeller to the suction side through worn clearances, consuming energy without delivering useful throughput.
Why Slurry Pumping Efficiency Is Not Just Pump Efficiency
Hydraulic efficiency — the ratio of fluid power delivered to shaft power input — matters. But it describes only the pump. In slurry service, the pump is one component inside a system where solids, wear, and pipeline conditions control the real outcome.
You need to track three things together:
- Energy efficiency as kWh per ton of dry solids moved. This is the number that shows up on your power bill and ties directly to production.
- Throughput stability — not peak flow, but whether the system delivers consistent tonnage shift after shift without plugging, bypassing, or slowing down.
- Wear-part life — because a pump that saves 5% on energy but doubles liner replacement cost is not cheaper to run.
A pump can show acceptable hydraulic efficiency on a test curve yet deliver poor slurry pumping efficiency in the field. The system forces it away from BEP, solids raise power without adding throughput, clearances have opened, or the pipeline demands more head than it should.
The corrective sequence that follows keeps these three priorities — energy, throughput, and wear — in balance at every step.
iCommon mistake: Checking pump efficiency in isolation from the system. You cannot diagnose slurry pumping efficiency from the motor panel alone. You need flow, head, density, and the system curve.
Measure the Right Baseline Before Changing Hardware
You cannot fix what you have not measured. Before trimming an impeller, adjusting a VFD, or ordering wear parts, collect a minimum field dataset at the current operating condition.
The baseline dataset
Take these readings at steady-state operation with the slurry at its normal solids concentration:
- Flow rate at a reliable measurement point — magnetic flow meter, Doppler, or a calibrated weir or tank fill test if no meter exists.
- Suction pressure and discharge pressure at the pump flanges, corrected to a common datum.
- Pump speed — from a tachometer, strobe, or VFD output.
- Motor input kW or motor amps with voltage and power factor so you can calculate actual input power.
- Slurry specific gravity — from a nuclear density gauge, Coriolis meter, or a weighed grab sample with a Marcy scale.
- Solids concentration — weight percent or volume percent, whichever your site uses consistently.
- Particle size distribution — at minimum the d50 and top size (d90 or d95). If the PSD has shifted from design, this alone can explain efficiency loss.
- Slurry temperature — affects viscosity and NPSH.
- Valve positions on the discharge, suction, and any bypass or minimum-flow lines.
- Sump level or suction vessel level.
- Operating hours since the last wet-end rebuild and wear-part replacement history.
Convert data to useful numbers
Estimate the pump shaft power required to deliver the measured flow and head:
$$P_{\text{shaft}} (\text{kW}) = \frac{Q \, (\text{m}^3/\text{h}) \times H \, (\text{m}) \times \text{SG}}{367 \times \eta}$$
For US customary units:
$$\text{BHP} = \frac{Q \, (\text{gpm}) \times H \, (\text{ft}) \times \text{SG}}{3960 \times \eta}$$
Where \( \eta \) is pump efficiency expressed as a decimal — from the manufacturer's published curve at the measured flow and speed, corrected for viscosity if the slurry rheology differs significantly from water.
Then calculate the specific energy that matters most:
$$\text{kWh/ton} = \frac{\text{Input kW}}{\text{Slurry solids throughput (ton/h)}}$$
Define your denominator clearly. Use dry metric tonnes of solids per hour, or specify if you are using wet tons or slurry volume. Inconsistent denominators cause false conclusions.
Compare your calculated shaft power against motor input kW. The gap shows how much energy is lost to pump inefficiency plus the motor and drive. If the gap has grown since commissioning, you have a wear or operating-point problem.
The U.S. Department of Energy frames the savings opportunity clearly. The avoidable energy cost from running away from the design efficiency is:
$$\text{Savings} = \text{kW}_{\text{in}} \times t \times \left(1 - \frac{\eta_a}{\eta_o}\right)$$
Where \( \eta_a \) is actual system efficiency, \( \eta_o \) is the optimal or design efficiency, and \( t \) is operating hours (DOE Pumping Systems Tip Sheet #4).
Do not use these screening calculations to justify capital expenditure without field verification. They identify where to look, not the final answer.
What the baseline reveals
A rising kWh/ton trend tells you the system is losing ground. A stable kWh/ton with rising motor kW tells you density or head has changed. A flat motor kW with falling flow tells you the pump is still drawing but moving less — usually wear or a system restriction.
🔴Caution: Do not assume the flow meter is correct without verification. A fouled, misranged, or air-entrained meter is the single most common source of bad efficiency diagnosis in slurry service. Cross-check flow against a secondary method — tank level change, a second meter, or a pump curve and pressure reading — before acting on the data.
Find Where the System Is Losing Energy or Throughput
Before you touch the pump, eliminate the system-side losses that mimic pump problems. In slurry service, the most expensive efficiency losses are frequently in the pipe, not the pump.
Throttled discharge valves
A partially closed discharge valve forces the pump to produce more head than the process requires. The operating point shifts left on the curve. Energy is wasted as heat and turbulence across the valve. In slurry service, throttling also increases internal recirculation through open clearances and accelerates localized wear in the valve itself.
If a valve is throttled to control flow while a VFD is available, fix the control strategy. If the valve is throttled because the pump is oversized for the duty, the permanent fix is an impeller trim or replacement — not indefinite valve throttling.
Bypass and recirculation lines
Bypass flow returns to the sump or suction without doing useful work. You pay for that energy twice: once to pump it and again as heat, turbulence, or sump disturbance. Measure or estimate bypass flow. If it exceeds the minimum required to prevent settling or protect the pump at low flow, close it.
Pipeline losses
Pipeline friction rises with the square of velocity in turbulent flow — the normal condition for slurry transport. Roughness increases as solids scour the pipe wall or as scale deposits narrow the bore. A pipeline that has been in service for five years does not have the same friction factor it had at commissioning.
Measure the head across the pipeline at the operating flow and compare it against the design system curve. If head loss exceeds design by more than 10–15%, inspect the pipe for:
- Internal scale or solids buildup reducing effective diameter.
- Excessive fittings, bends, or reducers added during plant modifications.
- Partially closed or damaged valves.
- Air pockets at high points if the pipeline has not been properly vented.
Critical deposition velocity and minimum transport velocity
Every slurry has a velocity below which solids begin to settle and form a stationary or sliding bed. Operating below this velocity is dangerous: it increases plugging risk, creates stratified flow that raises pipeline friction unpredictably, and causes the pump to work against a moving target.
ANSI/HI 12.1-12.6 notes that slurries can settle below a certain velocity. The exact minimum transport velocity depends on your specific PSD, solids concentration, pipe diameter, and solids density. Do not use a generic number. Verify the critical deposition velocity from the OEM's slurry transport data, a site-specific calculation using the ANSI/HI standard method, or historical operating experience at your plant.
If you are operating close to the critical deposition velocity, any speed reduction — from a VFD adjustment, impeller trim, or wear — may push you below it.
Suction-side problems
Suction restrictions, low sump level, vortexing, or air entrainment reduce NPSHA and can cause cavitation or unstable operation that looks like a pump efficiency problem. Check suction pressure and NPSHA against the pump's NPSHR at the operating flow.
NPSH margin is the safety band between available and required NPSH:
$$\text{NPSH margin} = \text{NPSHA} - \text{NPSHR}$$
NPSHA must exceed NPSHR for reliable operation, per ANSI/HI 9.6.1-2024. If the margin is thin or negative, fix the suction condition before diagnosing anything downstream.
💡Tip: A field method for rough NPSHA verification: measure suction pressure at the pump flange, convert gauge pressure to absolute head, add the velocity head at the suction nozzle, and subtract the liquid vapor pressure head at operating temperature. Do not subtract suction-line friction again when the pressure is measured at the pump flange; include suction-line friction only when calculating NPSHA from the sump or suction vessel surface. The vapor pressure of water at 20 °C is approximately 0.023 bar (0.34 psi), but check your slurry temperature and dissolved gas content.
Separate Slurry Problems From Pump Problems
Slurry properties change the answer in ways that water-based pump curves do not predict. Most pump efficiency diagnostics assume clean water. In slurry service, four properties dominate the efficiency equation.
Specific gravity and power draw
Pump power is directly proportional to SG. If your SG rises from 1.2 to 1.4 — a change you will not notice by looking at the pump — motor kW increases by roughly 17% for the same flow and head. This is not an efficiency loss; it is the correct physics of moving a denser fluid.
But it can mask a real efficiency problem. If flow drops while kW stays constant, the pump may be recirculating internally — and the higher SG is hiding the power that should have gone to throughput.
Track kWh/ton rather than motor kW alone. kWh/ton normalizes for density and tells you whether you are moving solids efficiently regardless of the SG that shift. Trend kWh/ton at comparable throughput rates. A spike at significantly reduced tonnage may reflect part-load fixed losses rather than wear or system degradation.
Viscosity and rheology
Fine particles at high concentration can create non-Newtonian behavior — the slurry has a yield stress or shear-thinning properties that raise apparent viscosity. Higher viscosity shifts the pump curve: it reduces head and flow at a given speed and increases power draw. The published water curve does not describe your pump's real performance in a viscous slurry.
If you suspect rheology effects, take a representative slurry sample and check the solids concentration and fines fraction (particles below 45 µm or 75 µm, depending on your industry). Clay, slimes, and ultra-fines are the usual suspects. The Hydraulic Institute's Slurry Properties Data Tool provides reference data for mixture properties across a range of solids types.
Particle size distribution and settling
PSD matters for two efficiency reasons: settling velocity and wear rate.
Coarse particles settle faster and require higher transport velocity, which increases pipeline friction and power draw. Fine particles stay in suspension more easily but can raise viscosity, as above.
A widening PSD — more fines from recirculation grinding, or more coarse particles from a process change — can shift the critical deposition velocity and the system curve. If you are fighting unexplained plugging or unstable flow, check PSD against your baseline.
NPSH in slurry service
NPSHR values published on water curves do not automatically apply to slurry. Entrained air, dissolved gas coming out of solution at the suction, and high solids concentration can reduce effective NPSHA or increase the required margin. ANSI/HI 9.6.1-2024 provides guidance on NPSH margin; for slurry service, consult the pump OEM for the recommended margin above the water NPSHR.
Even a new, unworn slurry pump operates below its water-curve hydraulic efficiency. ANSI/HI 12.1-12.6 provides an efficiency ratio (ER) to derate the water-curve efficiency for slurry service based on solids concentration, particle size, and SG. If your measured kW exceeds the water-curve prediction by an amount consistent with the ER, the gap may be a normal slurry effect rather than wear.
iNote: A pump that cavitates audibly in slurry may not cavitate on water at the same NPSHA. The vapor pressure of the carrier liquid does not change. But gas nucleation on particle surfaces and local pressure drops around solids can trigger cavitation earlier. If you hear intermittent crackling at the suction, do not dismiss it as normal slurry noise.
Correct the Operating Point Without Accelerating Wear
Once you have separated system losses from slurry effects, the next step is moving the operating point closer to where the pump was designed to run — without creating new problems.
BEP, POR, and AOR
Every slurry pump has a design flow — the BEP — where hydraulic efficiency peaks on water. Real slurry operation rarely sits exactly on BEP because the system curve includes variable solids loading, and the pump must stay above the critical deposition velocity.
ANSI/HI 9.6.3 defines two operating regions around BEP:
- POR (Preferred Operating Region): The flow range where reliability is highest, vibration is lowest, and wear is most predictable. This is where you want the pump to spend most of its time.
- AOR (Allowable Operating Region): A wider range where the pump can operate without immediate damage but with higher risk of recirculation, vibration, or accelerated wear.
The POR and AOR boundaries are pump-specific. They come from the manufacturer, not from generic percentages. Do not assume "±10% of BEP" or any fixed BEP percentage without confirmation from the OEM curve or the ANSI/HI standard.
Plot measured flow and head at operating speed on the published pump curve. If you are calculating head from pressure readings, convert pressure to head using the slurry SG; if the value is already expressed as head in ft or m of pumped fluid, do not apply an additional SG correction. If you are outside the AOR, you have an operating-point problem that no amount of maintenance will fix.
Speed control and VFDs
Reducing pump speed with a VFD can save energy. The affinity laws describe the approximate scaling:
$$Q_2 / Q_1 \approx N_2 / N_1$$
$$H_2 / H_1 \approx (N_2 / N_1)^2$$
$$P_2 / P_1 \approx (N_2 / N_1)^3$$
The cubic relationship on power means a modest speed reduction can produce a meaningful energy saving — on paper.
In slurry service, the affinity laws come with a hard constraint: you must maintain a velocity above the critical deposition velocity throughout the pipeline. If your speed reduction drops pipeline velocity below the settling threshold, the energy saving disappears into plugging events, unplanned shutdowns, and pipeline wear from sliding-bed abrasion.
Before reducing speed, calculate pipeline velocity at the proposed lower flow. Verify it exceeds the minimum transport velocity with a safety margin. The OEM or a site-specific slurry transport calculation should supply this number. Be aware that the cubic power relationship also assumes constant pump efficiency and homogeneous slurry. As velocity approaches the critical deposition velocity, solids stratification can cause actual power to deviate from the N³ prediction. Use the affinity laws for screening, not final energy guarantees.
Reducing speed also reduces NPSHR (approximately with \( N^2 \)), which can improve suction margin. Lower flow usually reduces suction-line friction losses, so NPSHA may improve as well. Still verify the actual margin under site conditions because sump level, slurry density, entrained air, and suction restrictions can change the result.
Impeller trim
If the pump is consistently oversized for the duty, trimming the impeller is a permanent correction that does not depend on VFD availability or control logic. Impeller diameter reduction shifts the pump curve downward. It matches the system curve at a lower flow and head without throttling losses.
Impeller trim is a link-out topic — the selection of the correct diameter, trim method, material removal limits, and effects on efficiency and wear belong in a dedicated impeller selection guide. The key point here is that an oversized pump trimmed to match the actual duty point will typically run more efficiently and wear more predictably than the same pump throttled to the same flow.
Why lowest kW is not always safest
A VFD set to minimize motor kW without considering slurry transport velocity can create the worst of both worlds: marginal energy savings and sharply higher downtime from plugging. A pump running efficiently on the motor panel while the pipeline slowly fills with settled solids is not efficient in any sense that matters to production.
🔴Caution: Slowing a slurry pump below the critical deposition velocity risks a stationary solids bed that can plug the pipeline, create dangerous pressure surges on restart, and cause uneven pipeline wear. Verify transport velocity at the reduced speed before adjusting the VFD downward.
Restore Efficiency Lost to Wear and Clearances
Wear is the slow thief of slurry pumping efficiency. It steals performance gradually enough that you may not notice it month to month — but your kWh/ton trend will.
How wear destroys efficiency
Slurry particles abrade the internal surfaces of the pump at every pass. The wear rate depends on particle size, hardness, concentration, velocity, and impeller material — topics explored in detail in our slurry pump impeller materials guide.
The efficiency impact comes primarily from three clearance paths:
- Impeller-to-throatbush clearance. The throatbush is the stationary wear component at the impeller suction eye. As this clearance opens, slurry recirculates from the high-pressure side of the impeller back toward suction. The pump can draw similar motor power while delivering less flow. Energy goes into accelerating the same slurry in a loop, not moving it forward.
- Impeller-to-liner clearance. The gap between the impeller shrouds and the casing liner lets high-pressure discharge flow return to lower-pressure regions inside the casing. This internal bypass reduces delivered head and flow.
- Casing and liner wear. Grooves, washout, or thinning in the volute or casing liner disturb the hydraulic profile. The pump's energy conversion from velocity to pressure becomes less efficient, and turbulence increases.
Spotting wear without opening the pump
Before you schedule a wet-end inspection, check these field signals:
- Head at a given flow is lower than the last baseline by more than 3–5%.
- Motor kW has not dropped proportionally — the pump is still burning power but the hydraulic output has fallen.
- Vibration at vane-pass frequency (number of vanes × running speed) has increased — often a sign of uneven impeller wear or recirculation instability.
- Seal flush pressure or leakage has changed — worn clearances can alter internal pressure distribution.
- kWh/ton has risen while flow, SG, and speed are unchanged — this is the clearest signal you will get without opening the pump.
💡Tip: Track kWh/ton and pump discharge pressure at the same flow and speed as a trend, not a snapshot. A monthly data point plotted for six months tells you more than a single measurement, because wear is gradual and seasonal slurry variation can mask it.
Clearance measurement and restoration
Measure impeller-to-throatbush and impeller-to-liner clearances against the OEM's wear limits. If they exceed the allowable value, restore them. Depending on the pump design, this may mean adjusting the impeller axial position, replacing the throatbush or liners, or rebuilding the wet end.
Wear ring clearance is a closely related topic. For centrifugal pumps with wear rings — more common in clear-liquid designs but present in some slurry pumps — the clearance and efficiency relationship is covered in a separate guide. In slurry pumps, the liner and throatbush typically serve the same function as wear rings, and clearance management is part of the same wet-end inspection.
Do not replace wear parts and assume the efficiency is restored. Re-baseline after the rebuild: measure flow, head, kW, and SG again and recalculate kWh/ton. The post-repair baseline is your proof that the fix worked — and your starting point for the next wear cycle.
Build a Practical Slurry Efficiency Action Plan
You have measured the baseline, identified system losses, separated slurry effects, corrected the operating point, and inspected for wear. Now put it together into a repeatable workflow.
The table below maps the most common slurry efficiency symptoms to their likely causes and the first diagnostic test:
| Symptom | Likely Causes | First Diagnostic Test |
|---|---|---|
| Rising kWh/ton | Worn clearances, SG increase, throttled valve, BEP offset | Plot duty point on pump curve; compare clearances to OEM limits |
| Falling flow, stable kW | Internal recirculation from wear, partially plugged suction | Measure head; if head is also low, inspect wet end |
| Falling head, stable kW | Impeller wear, liner washout, casing erosion | Compare head-flow point to original test curve |
| Rising kW, stable flow | SG increase, system curve shift (fouled pipe), viscous slurry | Check SG, PSD, and pipeline ΔP against design |
| Intermittent vibration | Cavitation, recirculation, settling/slugging, impeller imbalance | Check NPSH margin, duty point vs AOR, pipeline velocity |
| Frequent plugging | Below critical deposition velocity, PSD shift, sump level drops | Measure pipeline velocity; verify PSD against baseline |
| Motor overload trips | SG spike, pipe blockage, pump run-out to right of curve | Check valve positions, SG, system resistance |
| Rapid liner/throatbush wear | High velocity, coarse PSD, wrong material, off-BEP operation | Verify duty point; check material spec against PSD and pH |
7-step slurry efficiency field audit
Run this audit whenever kWh/ton rises, throughput drops, or wear rate accelerates unexpectedly. Each step includes what to measure, what to compare it against, and where to find the reference value.
- Collect the baseline dataset. Measure flow, suction/discharge pressure, speed, motor kW (or amps + voltage + PF), slurry SG, solids concentration, PSD, temperature, valve positions, sump level, and operating hours since last rebuild. Record all values at steady state.
- Calculate specific energy (kWh/ton). Divide motor input kW by solids throughput in dry tonnes per hour. Compare against the last two audit values. A rising trend without a change in SG or throughput is a wear or system-loss signal.
- Plot the duty point on the pump curve. Convert discharge pressure to head using actual slurry SG: H(m) = P(Pa) / (SG x 1000 x 9.81). If your instrument already reads head in metres of fluid column, no correction is needed. Mark the measured flow and head on the manufacturer's curve. Compare against BEP, POR, and AOR. If the point is outside the AOR, the operating point — not wear — is the dominant problem.
- Inspect the system for losses. Measure ΔP across the discharge valve — if it exceeds 10% of total discharge head, throttling is wasting energy. Check bypass flow. Compare pipeline head loss against the design system curve. Verify pipeline velocity against minimum transport velocity.
- Separate slurry effects. If kW has changed without a flow or head change, verify SG, PSD, and slurry temperature. Has the ore body, process water, or grinding circuit changed? A PSD shift or viscosity increase can explain the entire efficiency change.
- Inspect the wet end. If the operating point is acceptable and the system is not losing energy, open the pump. Measure impeller-to-throatbush, impeller-to-liner, and casing-liner clearances. Compare against OEM wear limits. Map the wear pattern — throatbush wear is usually suction-side recirculation; liner and casing wear points to off-BEP operation or abrasive overload.
- Correct, verify, and trend. Apply the correction — restore clearances, trim the impeller, adjust speed, fix the suction, clean the pipe — and re-baseline immediately. Record the new kWh/ton and duty point. Set a monthly trend check.
✓Decision Point: If steps 1–4 identify a system or operating-point issue, fix that before opening the pump. If steps 1–4 are clean but kWh/ton keeps rising, the problem is inside the pump. If you have completed steps 1–7 and efficiency has not recovered, the pump itself may be beyond economical repair or mismatched to the current duty. At that point, a heavy-duty slurry pump selection review may be the right next step.
If your slurry pump's kWh/ton is climbing and you are not sure whether the culprit is wear, the operating point, or the system, send our team your flow, head, kW, slurry density, solids data, pump curve, and recent wear photos. We will help you identify the most likely efficiency losses before you change hardware. Contact Dynapro
FAQs
What is slurry pumping efficiency?
Slurry pumping efficiency means moving the required solids tonnage at the lowest practical energy, wear, and downtime cost — not just achieving a high hydraulic efficiency on a water curve. It is measured in kWh/ton, tracked over time, and evaluated against throughput stability and wear-part life.
Why did kWh/ton rise if the pump is still running?
Three reasons account for most cases. Worn clearances let the pump recirculate slurry internally, drawing similar power while delivering less flow. The slurry SG or viscosity has increased without a corresponding throughput gain. Or a system restriction — throttled valve, fouled pipe, or bypass flow — forces the pump to work harder for the same output. Plot the duty point on the pump curve to identify which applies.
Can slowing a slurry pump save energy?
Yes — but only if you stay above the critical deposition velocity. Reducing speed cuts power with the cube of the speed ratio, but if the lower velocity lets solids settle, you trade an energy saving for plugging risk, pipeline damage, and lost production. Calculate pipeline velocity at the proposed lower speed before adjusting the VFD.
How does slurry density affect pump power?
Pump power is directly proportional to SG. If SG rises from 1.2 to 1.4, motor kW increases by approximately 17% at the same flow and head. This is correct physics, not a fault. Track kWh/ton rather than motor kW to normalize for density changes.
What field data do I need to diagnose efficiency loss?
At minimum: flow, suction and discharge pressure, pump speed, motor kW (or amps + voltage + power factor), slurry SG, solids concentration, PSD (d50 and top size), valve positions, bypass flow estimate, operating hours since last rebuild, and the manufacturer's pump curve. Without this dataset, you are guessing.
When is the problem the system instead of the pump?
The system or operating point is the likely culprit when: the duty point is far from BEP/AOR, the discharge valve is throttled, bypass flow is excessive, pipeline ΔP exceeds the design system curve, the pump is cavitating with adequate NPSHA on paper, or flow is dropping without a corresponding head loss. Rule out system causes before opening the pump.
---
References
- Hydraulic Institute, ANSI/HI 12.1-12.6: Rotodynamic Centrifugal Slurry Pumps for Nomenclature, Definitions, Application, and Operation, 2022: https://www.pumps.org/product/12-1-12-6-2022/
- Hydraulic Institute, ANSI/HI 9.6.3: Rotodynamic Pumps Guideline for Operating Regions: https://www.pumps.org/product/ansi-hi-9-6-3-rotodynamic-pumps-guideline-for-operating-regions/
- Hydraulic Institute, ANSI/HI 9.6.1-2024: Rotodynamic Pumps Guideline for NPSH Margin: https://www.pumps.org/product/ansi-hi-9-6-1-rotodynamic-pumps-guideline-for-npsh-margin/
- Hydraulic Institute, Data Tool — Slurry Properties for Pump Systems: https://datatool.pumps.org/fluid-properties-ii/solids
- U.S. Department of Energy, Improving Pumping System Performance: A Sourcebook for Industry (2nd ed.): https://www.energy.gov/sites/default/files/2014/05/f16/pump.pdf
- U.S. Department of Energy, Pumping Systems Tip Sheet #4: Test for Pumping System Efficiency: https://www1.eere.energy.gov/manufacturing/tech_assistance/pdfs/test_pumping_system__pumping_systemts4.pdf


