A centrifugal pump curve is the fastest way to stop guessing and start diagnosing. If you can read the curve, you can tell whether your pump is sized correctly, where it should run, how much power it will pull, and whether cavitation or seal failures are "baked in" by the operating point. This guide shows you how to interpret the four lines on a typical performance chart—then how to use them to make plant decisions that save energy and prevent failures.
Key Takeaways
- Myth Buster: Pumps do not create pressure; they create flow. The system resistance creates the pressure.
- The Map: The centrifugal pump curve is the only reliable way to predict performance, energy consumption, and failure risks.
- The Sweet Spot: Operating outside the Preferred Operating Region (POR) significantly reduces bearing and seal life.
- The Math: You can verify your motor sizing manually using the BHP formula provided below.

Introduction: The Map of Your Pump's Performance
A pump curve is your pump's "dyno sheet." It tells you what the machine can actually do at a given speed and impeller diameter.
Here's the mistake that costs money: buying or operating a pump without checking the curve is like buying a suit without measurements. You might get lucky. Most times, you don't—and you pay for it in:
- wasted kW (oversized pumps throttled by valves)
- cavitation (insufficient NPSH margin at the real operating point)
- seal and bearing failures (running off the best efficiency zone)
If you want reliability, you don't "hope" the pump fits the system. You confirm it on the curve.
The Anatomy of the Chart (Axes & Basics)
Before you read the lines, you need the axes.
X-axis: Flow rate (Q)
This is how much liquid the pump delivers:
- GPM (US customary) or m³/h (metric)
Flow is the "output volume."
Y-axis: Head (H)
Head is energy added to the fluid, expressed as height:
- ft or m
Crucial distinction: Head vs Pressure
- Head is energy per unit weight.
- Pressure (psi/bar) depends on specific gravity (SG).
Same pump, same head, different pressure:
- If a pump produces 100 ft of head, it produces 100 ft of head on water or heavy slurry.
- But the pressure gauge will read higher on the heavier fluid because pressure scales with density.
That's why pump curves use head, not pressure. Head lets you compare performance independent of fluid density—then you apply SG when you calculate pressure or power.
Centrifugal Pump Curve: The 4 Key Lines You Must Read
Most standard pump performance charts include four curves at a fixed speed (and often multiple impeller trims). Learn these four and you can interpret 80% of pump datasheets.
Picture it like this: as flow increases to the right, head usually drops, efficiency rises and falls, power generally rises, and NPSHr usually rises.
1) The H–Q Curve (Head vs Flow)
This is the main curve: head decreases as flow increases.
Two endpoints matter:
- Shut-off head: the head at zero flow (valve closed). You get maximum head, but you are not moving liquid. This is a dangerous place to run for more than a short time due to heating and internal recirculation.
- Run-out: the far right side (high flow, low head). This is where you can overload the motor and pull the pump into cavitation or unstable operation if suction conditions can't support it.
What this curve tells you: if your system requires a certain head at a certain flow, your operating point must land on this curve.
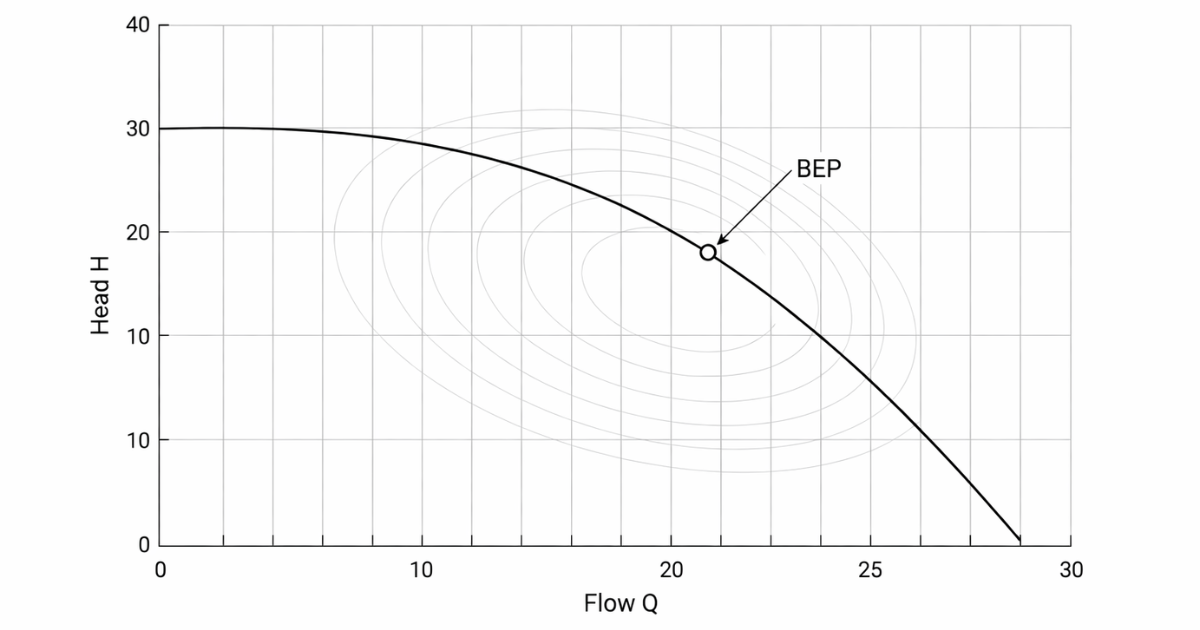
2) The Efficiency Curve (η)
This is the "hill" or "dome" shape.
- The peak is the BEP (Best Efficiency Point).
- Efficiency drops as you move left or right away from BEP.
What this curve tells you: how much of your motor power becomes useful hydraulic power.
3) The Brake Horsepower (BHP) Curve
This curve tells you how much shaft power the pump requires at each flow.
- BHP often increases as flow increases (common on many end suction and process pumps).
- Some designs may show flatter or peaked power behavior, but don't assume—read the curve.
What this curve tells you: whether your motor is sized correctly at the operating point (and whether you're at risk of overload near run-out).
4) The NPSHr Curve (Net Positive Suction Head Required)
This curve tells you the minimum suction energy the pump needs to avoid excessive cavitation for the test condition.
- NPSHr often rises with flow (commonly a "J" shape or upward trend).
- You compare it to NPSHa (available) in your system.
What this curve tells you: whether cavitation is likely at your real operating point, and whether you need suction improvements or a different pump selection.
Understanding the BEP (Best Efficiency Point)
BEP is the sweet spot where the pump runs most efficiently and most smoothly. It's not just about energy—it's about internal hydraulic balance.
When you run near BEP:
- radial hydraulic forces are lower
- vibration tends to be lower
- seals and bearings generally last longer
POR vs AOR (the operating regions that matter)
Two operating regions show up in modern pump standards and reliability practice:
- POR (Preferred Operating Region): where efficiency and reliability are not substantially degraded.
- AOR (Allowable Operating Region): wider range where operation may be acceptable, but reliability typically declines versus POR.
Hydraulic Institute defines these operating regions in its standards guidance (POR/AOR).
Do not tattoo a single percentage on your forehead. The "safe" range varies by pump type, size, hydraulic design, and manufacturer limits. Guidance often gets summarized with ranges like 70–120% of BEP for preferred operation, but you must confirm against the applicable standard and the OEM curve notes for your exact pump.
Find the Duty Point: Where Your Pump Meets Your System
Here's the missing link most buyers never learn:
The pump curve alone does not "pick" your flow.
Your operating point is where the pump curve intersects the system curve (your piping + static head + friction losses).
- The pump curve says what the pump can produce.
- The system curve says what the system demands at each flow.
Their intersection is the duty point.
If your plant changed something—valve positions, pipe routing, elevation, fluid properties, fouled strainers—your system curve moved. Your pump didn't "get worse" overnight; your operating point shifted.

Troubleshooting with the Curve: Where are you operating?
Once you understand BEP and duty point, curve troubleshooting becomes straightforward.
If you're operating left of BEP (low flow)
This is common with oversized pumps throttled by control valves.
What you see in the field:
- higher vibration
- noise that comes and goes
- rising seal failures
- temperature rise in the casing on low-flow operation
What's happening:
- internal recirculation increases
- radial loads increase
- hydraulic instability rises
Warning: If you see high vibration and repeated seal issues, check whether your duty point is too far left—then confirm minimum continuous stable flow for your pump and service.
If you're operating right of BEP (high flow / run-out direction)
What you see in the field:
- cavitation noise (gravel / crackling)
- unstable suction pressure
- motor trips (overload)
- chronic bearing heating
What's happening:
- NPSHr rises and may exceed NPSHa
- power demand can climb
- flow can become hydraulically unstable at extremes
Warning: If you're near run-out, verify motor margin and NPSH margin at the real operating point—not at "design assumptions."
How Speed and Impeller Diameter Affect the Curve
You have two practical levers to move performance without buying a new pump.
Impeller trimming (diameter reduction)
Trimming reduces impeller diameter, shifting the curve downward.
Use trimming when:
- the pump is consistently oversized
- you want a permanent correction
- you want better valve position / less throttling loss
Tradeoff: too much trim can reduce efficiency or move BEP unfavorably. Use OEM trim limits.
VFD speed control (variable speed)
Changing speed shifts the curve more dynamically.
Use a VFD when:
- your system demand varies over time
- you want to reduce throttling losses
- you want better control and energy savings
Affinity laws (quick sanity checks)
For the same pump geometry (and within reasonable ranges):
- Flow: \( Q \propto N \)
- Head: \( H \propto N^2 \)
- Power: \( P \propto N^3 \)
These are helpful for quick estimates, not a substitute for full curve evaluation—especially if viscosity, solids, or suction conditions change.
Calculating Power: The Math Behind the Curve
You should be able to hand-check the BHP curve. This is how you catch motor sizing mistakes.
The core relationship (US customary units)
$$ \mathrm{BHP} = \frac{Q \times H \times SG}{3960 \times \eta} $$
Where:
- \( Q \) = flow (gpm)
- \( H \) = head (ft)
- \( SG \) = specific gravity (dimensionless)
- \( \eta \) = pump efficiency (decimal, e.g., 0.80)
ASSUMED ILLUSTRATIVE EXAMPLE (verify for your case)
You are moving 500 gpm at 100 ft head, SG = 1.0, and η = 0.80.
Step 1: Multiply flow and head: \( 500 \times 100 = 50{,}000 \)
Step 2: Multiply by SG: \( 50{,}000 \times 1.0 = 50{,}000 \)
Step 3: Multiply denominator: \( 3960 \times 0.80 = 3168 \)
Step 4: Divide: $$\mathrm{BHP} \approx \frac{50{,}000}{3168} \approx 15.8\ \mathrm{HP}$$
Shop-floor warning: This is pump shaft power. Your motor input kW will be higher due to motor efficiency and power factor. And if your fluid SG is higher than 1.0, BHP scales up directly.
Reading the Curve: Key Terms & Definitions
| Term | Symbol | What it tells you |
|---|---|---|
| Flow rate | Q | How much liquid you deliver (gpm / m³/h) |
| Total Dynamic Head | H / TDH | Energy added to the fluid (ft / m) |
| Efficiency | η | How much input power becomes hydraulic power |
| Brake horsepower | BHP | Shaft power required at each flow |
| Shut-off head | — | Max head at zero flow (do not run here continuously) |
| Run-out | — | High-flow extreme; risk of cavitation or overload |
| NPSH required | NPSHr | Suction energy needed to limit cavitation at test condition |
| Best efficiency point | BEP | Peak efficiency point; best reliability zone |
Step-by-Step: 60-Second Pump Curve Sanity Check
- Confirm curve conditions: speed (RPM/VFD), impeller diameter/trim, and fluid SG/viscosity match your service.
- Mark your duty point: required min/normal/max flow(Q) and head(H), then locate it on the H–Q curve (not just a single point).
- Check operating region: verify how far you are from BEP (POR first, AOR second—per the applicable standard/OEM notes).
- Verify motor margin: read BHP across the duty band and confirm motor margin, especially toward run-out.
- Verify NPSH margin: compare NPSHa vs NPSHr at the duty point (use real suction conditions, not design assumptions).
- Pick the lever: if you're off-region, decide whether the fix is trim, speed control, or right-sizing.
Dynapro Tip: If your current pump operates far to the left (low-flow) or far to the right (run-out), you may need an impeller trim, speed control, or right-sizing. Dynapro engineers can review your duty point and help align your pump curve with your actual system curve.

FAQs
Q1: Why does the pump curve slope downwards?
A: As you allow more flow, the pump can't maintain the same head because internal losses rise and the pump's energy conversion shifts. More flow usually means less head for a given impeller and speed.
Q2: What is the difference between Head and Pressure?
A: Head is energy per unit weight (ft/m) and is the main performance metric on pump curves. Pressure (psi/bar) depends on fluid density. Same head, different pressure if SG changes.
Q3: Is it safe to run a pump at the far left of the curve (Shut-off)?
A: No. You can overheat the pump, increase internal recirculation, and spike radial loads. Only tolerate shut-off briefly (seconds), then move back into a stable flow region.
Q4: What happens if I run too far to the right (Run-out)?
A: You risk cavitation and motor overload. NPSHr rises with flow, and power demand can climb fast near run-out.
Q5: How does viscosity affect the pump curve?
A: Higher viscosity reduces flow, reduces head, reduces efficiency, and often increases BHP. You need viscosity corrections (Hydraulic Institute provides guidance for viscous corrections in separate standards).
Q6: Why is the BEP (Best Efficiency Point) so important?
A: BEP is where the pump's internal hydraulic forces are most balanced. Running near BEP typically lowers vibration and improves seal and bearing life.
Q7: Can I change the pump curve without buying a new pump?
A: Yes. You can trim the impeller (permanent) or change speed with a VFD (dynamic). Use the OEM limits and verify you stay within acceptable operating regions.
Q8: Does a slurry pump have a different curve than a water pump?
A: Published curves are typically for water. Slurry requires derating (head and efficiency losses) and careful NPSH evaluation. Use OEM slurry correction guidance.
Q9: What is the "Family Curve"?
A: It's a chart showing multiple impeller diameters (trims) for the same pump casing model, letting you pick the trim that hits your duty point.
Q10: Why does the NPSHr line curve upwards at high flow?
A: At higher flows, velocity and losses at the impeller eye increase, which increases the suction energy required to control cavitation.
Need help validating your pump curve?
If you want a quick sanity check on your duty point, NPSH margin, and motor sizing, send us a message using our Contact Us form and we'll reply as soon as possible.


